The battery that falls off a cliff, part 2: one weak cell per module
An overnight CAN log of my Dyness B3 stack traced the sudden SOC drops to one weak cell in each of two modules, and the evidence is now with Dyness UK.
In part 1 a home-made USB-CAN cable got me per-cell data from the three Dyness B3 modules, and the first reading on 8 Oct showed the modules disagreeing about their own charge by about 29 points at the same cell voltage. The obvious next step was to watch a whole charge, cell by cell.
Overnight
The stack is grid-charged to 100 % every night on a cheap tariff window, so that charge was the test. Claude Code wrote a logger for it. It opens the adapter in hardware listen-only mode, so nothing is ever sent on the battery’s bus, and writes a raw log of every frame, a decoded CSV with one row per module per second, and an event log.
It ran on a Mac under caffeinate, so the Mac doesn’t go to sleep. If no frame arrives for 30 seconds it reopens the bus, because the adapter has form for going quiet. An excerpt from overnight_logger.py, trimmed and simplified, so it doesn’t run on its own:
1
2
3
4
5
6
7
8
9
10
11
12
13
14
15
16
17
18
19
20
if not a.poll:
    _start = gs.GsUsb.start
    gs.GsUsb.start = lambda self, flags=0: _start(self, GS_CAN_MODE_LISTEN_ONLY | GS_CAN_MODE_HW_TIMESTAMP)

SILENCE_S = 30
while True:
    try:
        bus = d.open_gs_usb(0, 500000)
        last_rx = time.time()
        while True:
            now = time.time()
            msg = bus.recv(timeout=0.05)
            if msg is not None:
                t = time.time()
                latest[msg.arbitration_id] = (t, bytes(msg.data))
                last_rx = time.time()
            elif now - last_rx > SILENCE_S:
                raise RuntimeError(f"no frames for {SILENCE_S} s")
    except Exception as e:
        log(f"error: {type(e).__name__}: {e}; reconnecting in 5 s")
The cell frames kept streaming all night without a single poll.
The charge ran from 23:29 to 01:41 at about 63 A, with the modules starting at 42 %, 13 % and 12 %. Module 1 behaved: its cells rose together, its SOC (state of charge) climbed steadily, and it reached 100 % at 01:41.
Modules 2 and 3 didn’t. In each, one cell pulled away from the rest: cell 8 in module 2, cell 9 in module 3. A module’s BMS (battery management system) only corrects its SOC at the top when a cell reaches 3.50 V. At 00:59 module 2’s cell 8 got there with the module at about 55 % (the chart’s own labels say 53 %), and its SOC jumped to 100 % in 80 seconds. Module 3’s cell 9 did the same at 01:11–01:13, at about 56–58 %. Between 01:31 and 01:41 both weak cells reached 3.55 V and tripped cell over-voltage protection while their neighbours sat at about 3.40 V.
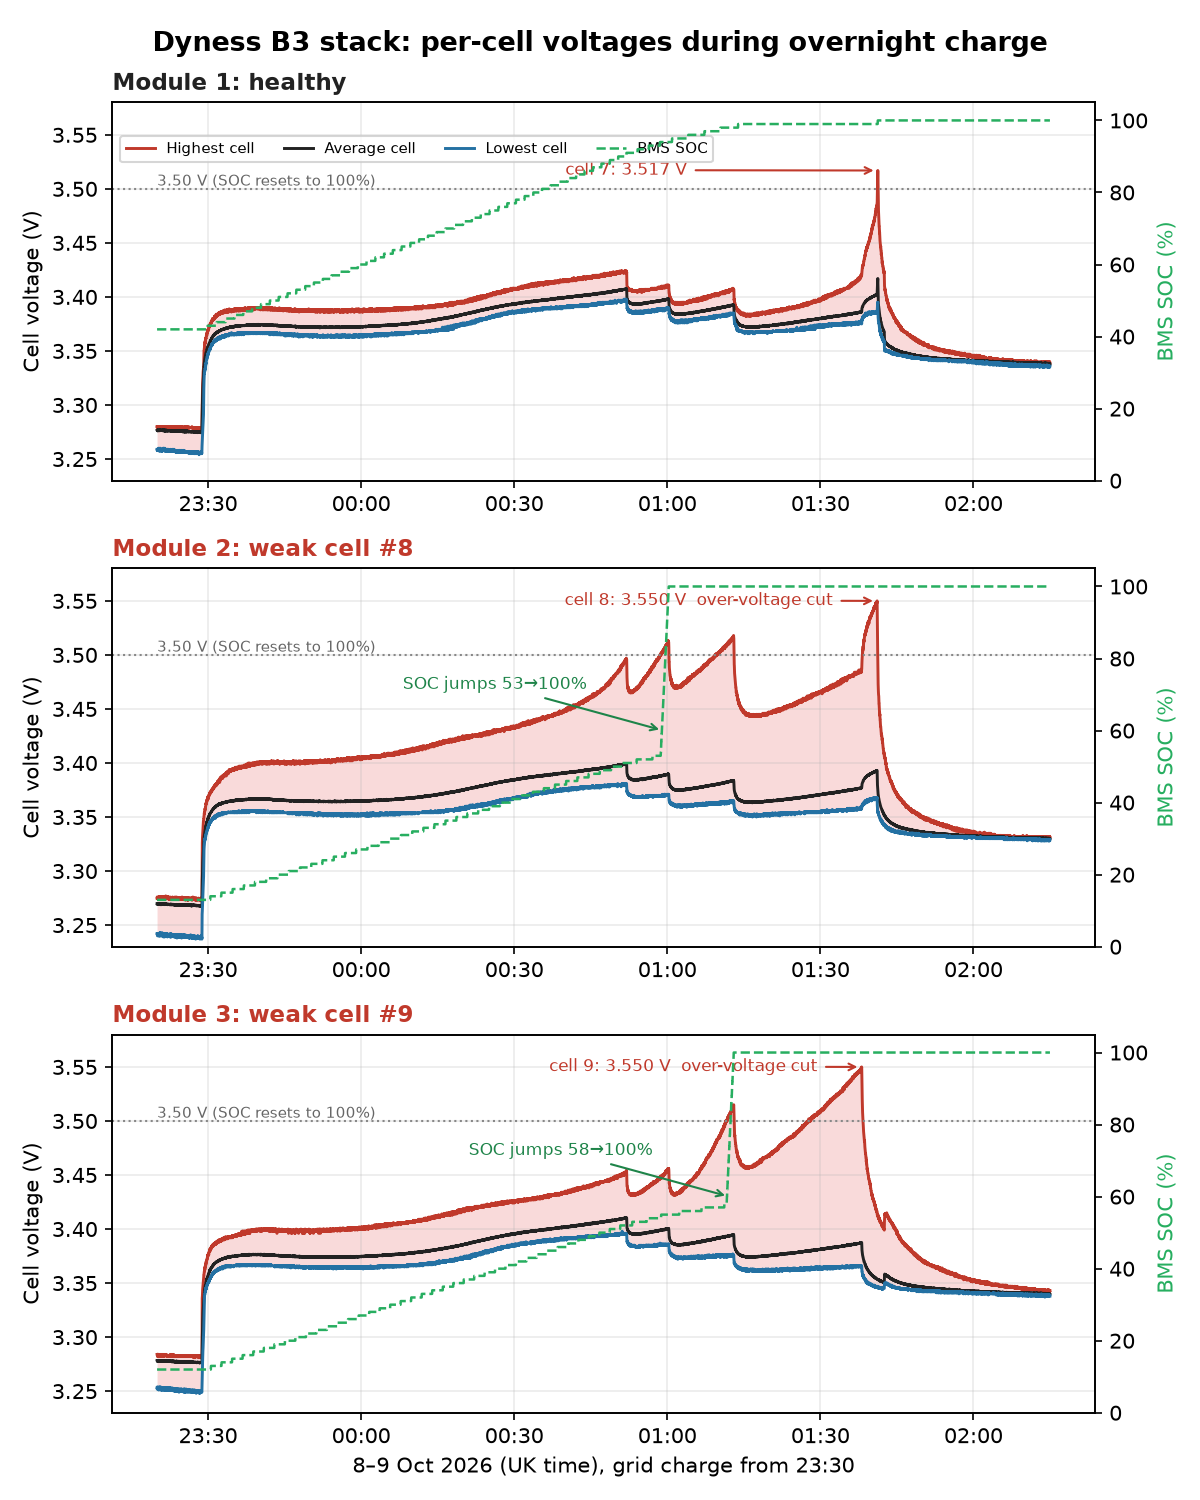
The charge counted into each module tells the rest: 42 Ah, 33 Ah and 34 Ah. Module 1 took the most despite reading 30 points fuller, so modules 2 and 3 were never near empty. The stack took about 5.6 kWh from a reported 22 %, so it was really about 48 % full.
And on the way down
The same cell causes the evening drop. At the bottom, a module re-zeroes its SOC when a cell sags to 2.95 V. Working back from the module readings, on 8 Oct modules 2 and 3 each still had about 34 % counted when their weak cell hit that floor, and both snapped to 0 %. Module 1’s cells didn’t get there, so it stayed at about 28 %.
As part 1 showed, the inverter only gets the average of the three module SOCs, in frame 0x355. Two modules going from 34 % to 0 % together turned 32 % into 9 % in one step, at only about 470 W. The size of the drop depends on which modules reset, which is why it looked as though it was getting worse.
Evening: every module thinks it has about 30 % left.
The weak cell runs out first, so its module reports 0 %.
The inverter sees the average of the three, so two modules hitting 0 % together drops the app from about 30 % to about 9 %, while every module still holds energy. The same happens at the top: the weak cell fills first and its module jumps to 100 %.
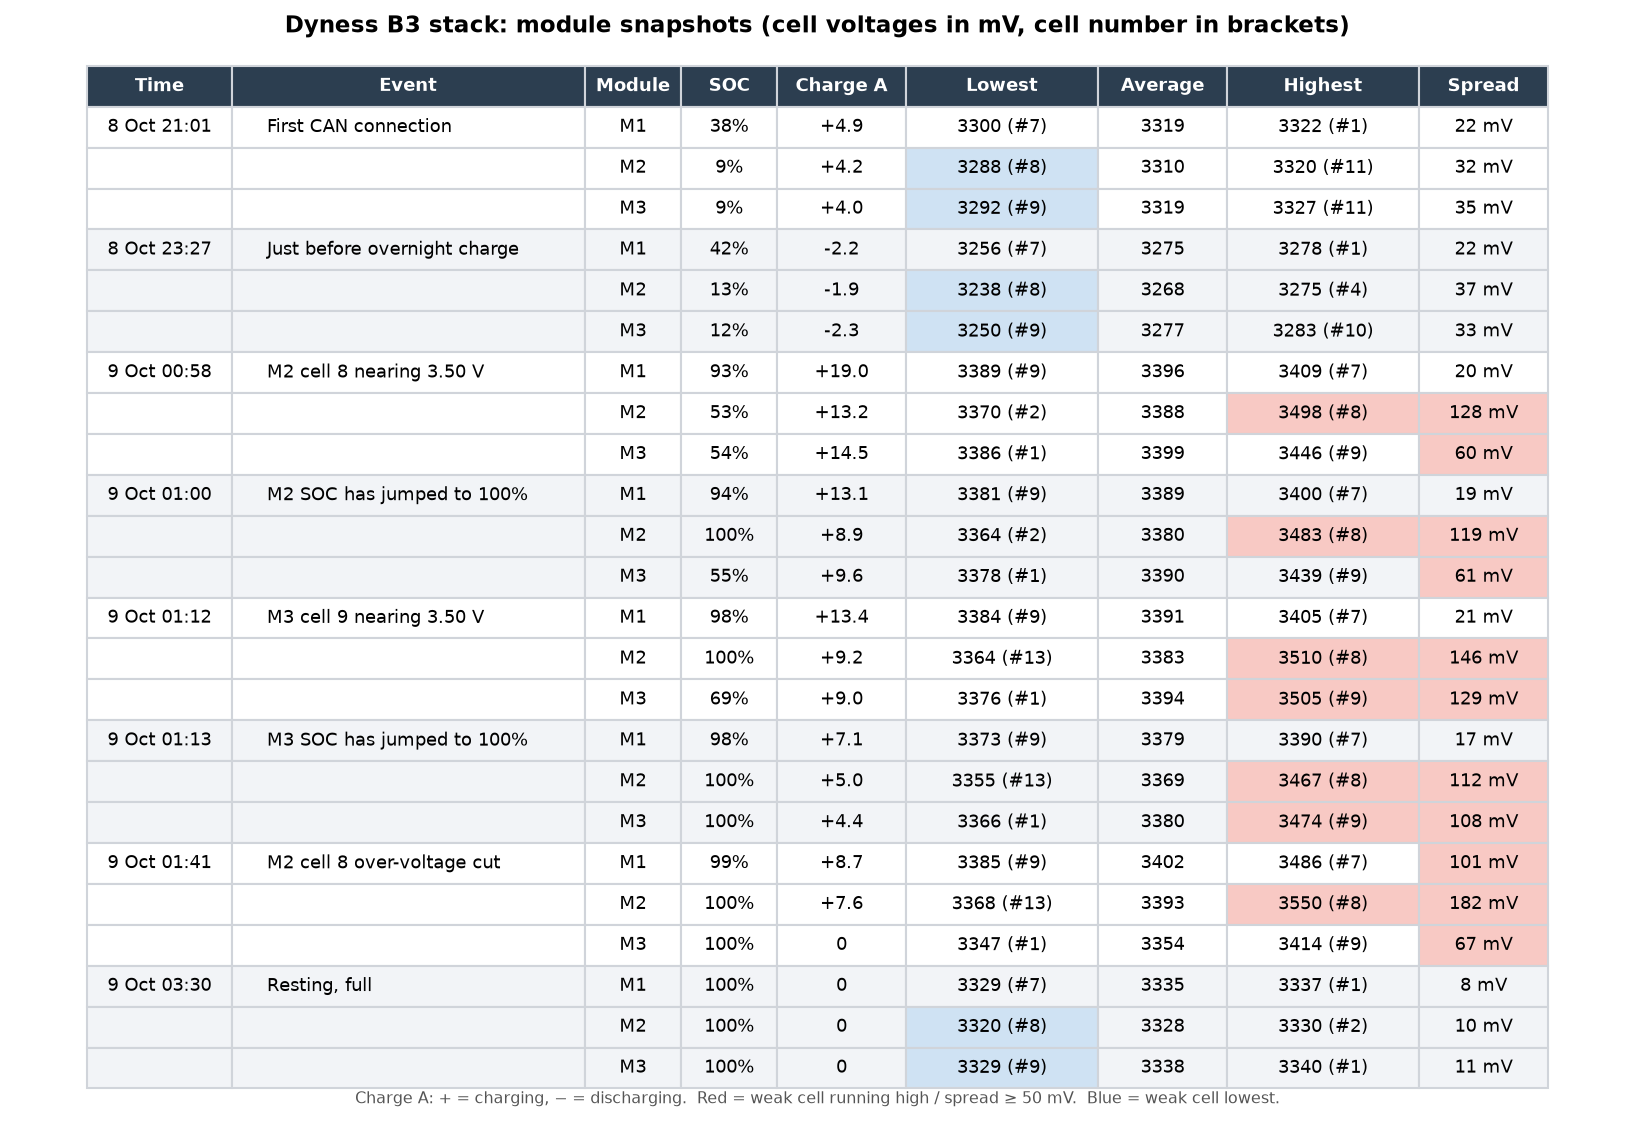
I also ran two step tests at about 62 A: a charge from near empty on 8 Oct and a discharge from a synced 100 % on 9 Oct. Each cell’s voltage change 20–40 seconds in gives an apparent resistance. It includes polarisation, so it’s for comparison only.
| Cell | Charge step (mΩ, vs module median) | Discharge step (mΩ, vs module median) |
|---|---|---|
| Module 2, cell 8 | 4.59 (+66 %) | 4.78 (+102 %) |
| Module 3, cell 9 | 3.79 (+44 %) | 3.48 (+57 %) |
| Module 1, worst cell | no outlier above +28 % | cell 11, +35 % |
The weak cells are high in both directions and at both ends of the charge, and recovered to their usual offset within five minutes of the discharge step. Cell 6 read high in every module, both times, which points at the busbar or sense lead in the measurement path rather than a cell.
The cost is energy. From the BMS reporting 100 % to the drop, the stack gave 6.67 kWh on 5 Oct and 6.95 kWh on 8 Oct, against about 8.6 kWh for 80 % of 10.8 kWh. Modules 2 and 3 work over roughly 55–65 % of their rated 75 Ah each cycle.
What the BMS can’t tell you
Put side by side, the three modules look like this:
- Worst cell resistance
- +35 %
- Charge taken overnight
- 42 Ah
- BMS health (SOH)
- 97 %
- Cell 8 resistance
- +66 % / +102 %
- Charge taken overnight
- 33 Ah
- BMS health (SOH)
- 97 %
- Cell 9 resistance
- +44 % / +57 %
- Charge taken overnight
- 34 Ah
- BMS health (SOH)
- 97 %
Resistance is against the median cell in the same module, on charge / discharge (module 1's worst is on discharge).
The BMS reports 97 % SOH (state of health) for all three modules. By its own account nothing is wrong.
Nor will it fix itself. Balancing only starts when cells are above 3.30 V and at least 30 mV apart, and on the flat middle of an LFP (lithium iron phosphate) curve that gap rarely shows up. Worse, during a charge module 2 balances by bleeding its highest cell, which is now the weak cell 8, leaving it lower still at the bottom of the next discharge. The charge-current limit is a lookup on estimated SOC, not on cell voltage: 37.5 A per module (a third of the stack figures in part 1), 30 A from 81 %, 15 A from 91 %, 0 A at 100 %. Once a module has decided it is full, nothing on the inverter side can push more in.
That is why none of the earlier fixes from part 1 could work. User-Define mode with 54 V equalise still stopped when the BMS said 100 %, charge currents from 25 to 64 A ended at the same point, and holding at 100 % for hours just sat at 0 A. The problem isn’t where the charge stops; it’s one cell in each of two modules.
If you have a Dyness stack doing this: listen on the spare link port at the end of the chain rather than unplugging anything, and read every cell before believing the percentage. Don’t write BMS parameters. The same bus carries the parameter-write frames, and changing them without Dyness involved risks the battery and the warranty.
Claude’s part in this half was the analysis: Claude Code wrote the scripts, the charts above and the findings write-up from the overnight capture. It also got things wrong that the data corrected. In the claude.ai chat it said balancing needed about 3.4 V; the parameter values say 3.30 V with a 30 mV gap. After the video of the alarm lights it suspected a loose power connection, which the even current split ruled out. And its summary after the 8 Oct reading blamed SOC counters drifting while the cells were broadly healthy. The overnight charge overturned that: the stack resyncs to 100 % every night, so drift between charges can’t be the cause.
Over to Dyness
On 9 Oct I sent Dyness UK the evidence above and asked for a warranty assessment of modules 2 and 3. This isn’t a job for a screwdriver and a multimeter on my side.
A few things are still open on my side:
- Which box is which. Module numbers are CAN addresses. The red ALM (alarm) LEDs on 8 Oct were on the middle and bottom boxes, which fits, but I still need to match each DIP address and serial number to a physical box.
- Firmware. Each module’s BMS firmware version isn’t in the CAN frames, but Dyness can read them, and modules in a stack should run the same version.
- Capacity. A slow discharge from a synced 100 % should show whether the weak cells have also lost capacity, or only gained resistance.
Against the explanations I started with: one weak cell per module and the modules disagreeing about SOC are confirmed, the high resistance is confirmed, whether those cells have also lost capacity is still open, and a bad power connection is unlikely. No reply from Dyness yet.
What’s next
- Wait for Dyness, and finish the slow-discharge test in the meantime
- Publish per-cell data to Home Assistant over MQTT, so a cell running away shows up on a dashboard and not in an overnight CSV
- Keep the overnight logger running
I wrote this post with help from AI tools (Claude, Codex). I review, edit and check everything before publishing. How I use AI